
In this post, I'll show you how to get, install, and configure windbg so that you can debug and or review dump files.
What you will need:
1. Debugging Tools: click here
2. Mex Extension: click here
3. Microsoft Symbols Server Info: click here
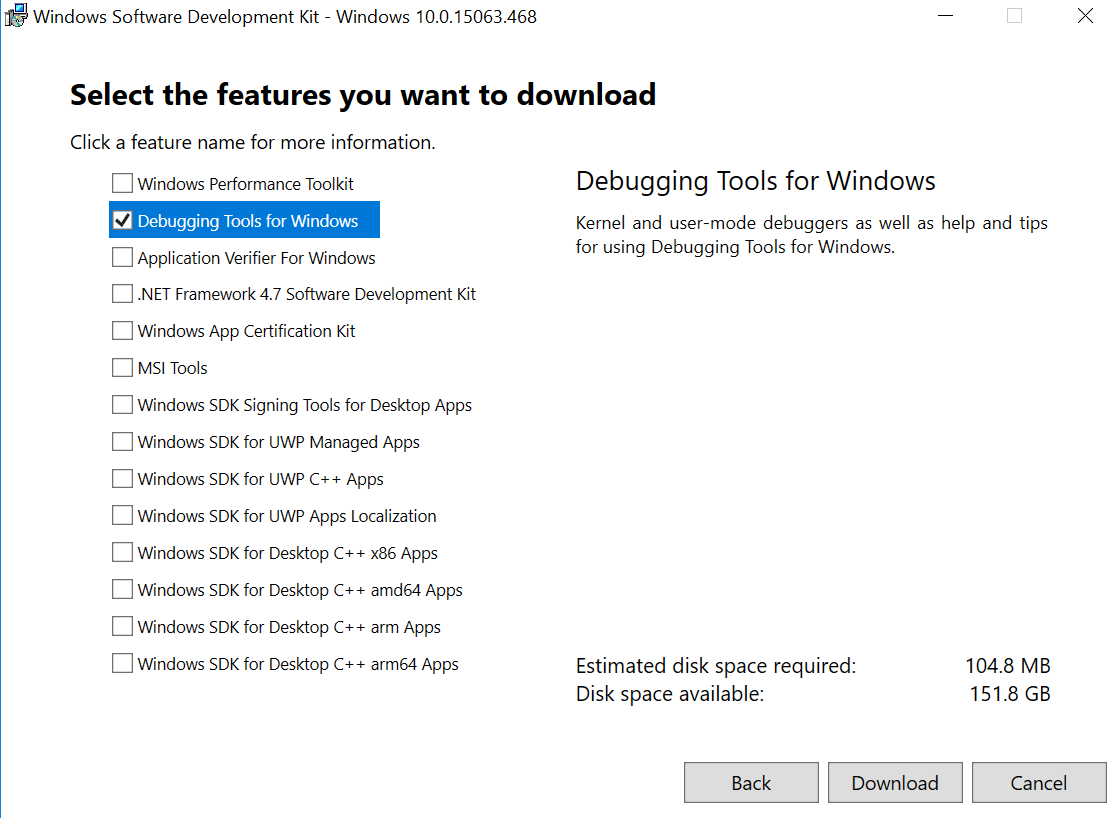
Download the Windows SDK from the link above and install the Debugging Tools for Windows.
Download the Mex Extension and extract the files. You should have an x64 and x86 mex.dll files for adding the mex extensions.
If you installed the tools to the default path, go to:
C:\Program Files (x86)\Windows Kits\10\Debuggers\x64\winext
Copy the x64 mex.dll file into this folder.
Now go to the following location:
C:\Program Files (x86)\Windows Kits\10\Debuggers\x86\winext
Copy the x86 mex.dll file into this folder.
Inside the Debugger
Go to Start > Windows Kits > Windbg(x64) and then run this as administrator.I am going to open a dump file called MEMORY.DMP. Go to File > Open Crash Dump and then navigate to C:\Windows\MEMORY.DMP. You may not have this as it was created when my computer blue screened.
If you need to create a dump file, you can create a process dump by opening Task Manager, going to the Details tab, and then right clicking on one of the processes. After you right click on a process select Create Dump File. This will create a dump file that you can open with Windbg.

Now you can open this dump file in Windbg. Once it is open, type .chain and hit enter. It should look something like this...

Now lets load the mex extension. Type .load mex and hit enter.

Now you can do a .chain and you will see the mex extension.

NOTE: You will need to load your mex extension each time you open your debugger.
Configure Symbols
Create a folder (in our case we are creating at the root of C, but you can create it anywhere) called Symbols.Go to your debugger and click File > Symbol File Path.
Enter the following path: srv*c:\symbols*https://msdl.microsoft.com/download/symbols
*** Be sure to reflect the right local path here - in my case it's C:\Symbols, but might not be on your machine***

You should see something like the following on your computer:

You now have windbg installed, the mex extension loaded, and your symbols configured. Now we need to add an environment variable and we are pretty much done.
Go to System Properties > Environment Variables.
We will add the following variable:
_NT_SYMBOL_PATH = srv*c:\symbols*https://msdl.microsoft.com/download/symbols

USE COMMANDS
In my case, I have a crash dump. One of the first commands I look at is !analyze -v. You can see what the output looks like.
This command gives you more information about the bugcheck. In this case you can see a lengthy description that can help point you in the right direction. You can see the .sys file that is involved. And you can scroll down to see the stack text.

You can click on the Module Name to get more information about the module.


To get a list of tools you can use in the mex extension, type !mex.

That said, with some practice, this can help you get further in your troubleshooting than you would by simply reviewing logs.
RESOURCES
https://blogs.msdn.microsoft.com/ntdebugging/http://windbg.info/doc/1-common-cmds.html
https://theartofdev.com/windbg-cheat-sheet/
No comments:
Post a Comment