Showing posts with label Performance Monitor. Show all posts

Monday, July 11, 2022

Windows Performance Thresholds

This article outlines a general Windows performance troubleshooting approach. It also contains some of the more important performance counters and the thresholds that indicate some kind of performance issue.


Some Definitions

  • Complete System Hang - System does not respond to any input from the keyboard or mouse for more than 1 minute after the system has already booted.
  • Hardware Hang - Hang due to hardware related problem.
  • Software Hang - Hang due to software related problem.
  • Application Hang - Application does not respond to any input from the keyboard or mouse for more than 1 minute after application is fully loaded. System is responsive, but application is not. Can be verified in Application event log (Event 1001).
  • Application Crash - Application closes due to exception. Can be verified in Application event log (Event 1000).


Friday, May 6, 2016

PowerShell Performance Diagnostics Utility


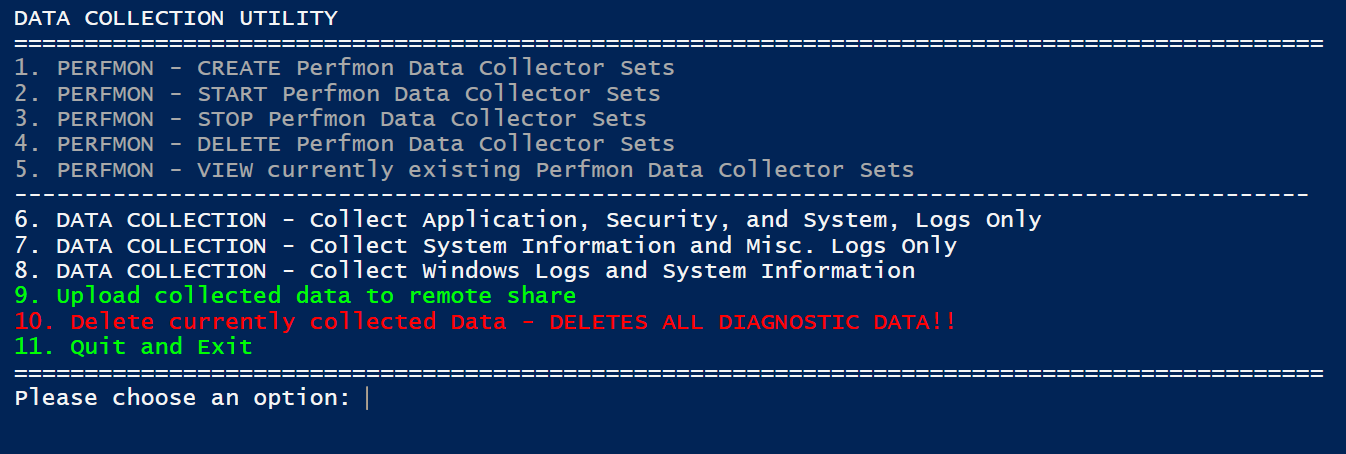
SCENARIO: You want to be able to create, start, stop, and delete Performance Monitor data collector sets and collect logs from your computer using a menu.  You can do all of these things manually, but this script will present you with a menu for performing these tasks.

NOTE: This will work in Windows 10.  If you are running on an older version of PowerShell, you will need to change Get-CimInstance cmdlet along with the Get-GPResultantSetOfPolicy cmdlet.

UPDATE: 11-06-2017 - I just pasted a newer version of this script below.

Click Here to Download Script: Data Collection Utility

Folder Structure:


Wednesday, April 6, 2016

Create Perfmon on Remote Machines


Scenario: You want to start perfmon on several remote machines.  You have a list of machines, but you don't want to remotely create and start those perfmon data collector sets.

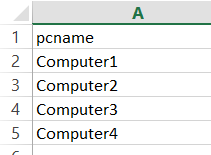
Here is a PowerShell script that you can use to start up perfmon data collector sets on a remote machine.  It pulls the list of computers from a .csv file called "computers.csv".  Your .csv should looks something like this:


Saturday, June 27, 2015

Using Perfmon to Analyze High CPU Usage.


Scenario

Your CPU utilization is maxing out and you want to find how what is responsible for the high CPU.  Sometimes the process is obvious in that you can look at task manager to see who is using the most CPU, but that alone doesn't give you a snapshot of what is happening on your server over a period of time.

To begin, use the instructions from this article to capture perfmon data while you are experiencing the high CPU state.  Let it capture a decent amount of time so that you can see trends.

After you capture the perfmon data, open it up by double clicking on the appropriate .blg file in the C:\Perflogs folder.  You should see something like the above image.  Unfortunately, this image isn't terribly helpful.  So we will need to remove all the counters and then start by adding counters systematically.

Tuesday, September 9, 2014

How to Setup Alerts Using Perfmon

Scenario

Say you find that the CPU utilization on your computer or server keeps spiking, but it does so at random times.  If you are looking in task manager, you might be able to identify which process is responsible for the spikes.  Now say you want to be notified when these spikes occur.  You can actually use a built in Microsoft product to send alerts and or log events like this.

Microsoft Performance Monitor.

Using Microsoft's Performance Monitor, you can select counters such as "%Processor Time" or "Handle Count" and then trigger alerts based on these counters. Microsoft has a lot of counters that you can use so that you can monitor computer or server with a high degree of granularity.  Here is an example of the Processor Object containing counters for CPU usage: http://msdn.microsoft.com/en-us/library/ms804036.aspx. You can also monitor memory, disk usage, network usage, etc.

You can set up a data collector set that will allow you to be notified, for example, when a process reaches 60% User Time.  When you do this, you will receive an alert every time this threshold is met.

Unfortunately, while you can setup these alerts to be tripped when a counter reaches a threshold, you can't set it up to alert  you when, say the %Processor reaches X amount for Y duration.

Sunday, September 7, 2014

How to Setup Performance Monitor Data Collector Sets to Monitor System Performance

Scenario

Are you having issues with the performance of your PC or server?  If so, you can use Microsoft's Performance Monitor to see performance trends over a period of time.  In this post, I will talk about how to collect the data you need in order to assess your issue. I will talk more about analysis of the data you collect in other posts.

Overall Steps for Data Collection


  1. Create two DCS.
  2. Start both DCS.
  3. Wait for the performance issue to occur.
  4. After you are sure that you captured data during the problem, stop the DCR.

We will be creating two separate data collector sets.  We will basically create two identical data collector sets.  The only difference between the two sets will be the polling interval.  Performance Monitor data collector sets poll data collectors providers at a whatever interval you specify.  We will set one of the intervals to 2 seconds and the other to 4 minutes.

Why would we do this?

In order to catch problems related to the CPU, we will need to poll at intervals no greater than 3 seconds.  For memory issues, we need the interval to be longer.  We will be creating circular logs which will overwrite the oldest data once they reach their size limit.  In the case of memory issues, we usually want to collect data over a period of days or even weeks.