
Scenario
Your CPU utilization is maxing out and you want to find how what is responsible for the high CPU. Sometimes the process is obvious in that you can look at task manager to see who is using the most CPU, but that alone doesn't give you a snapshot of what is happening on your server over a period of time.To begin, use the instructions from this article to capture perfmon data while you are experiencing the high CPU state. Let it capture a decent amount of time so that you can see trends.
After you capture the perfmon data, open it up by double clicking on the appropriate .blg file in the C:\Perflogs folder. You should see something like the above image. Unfortunately, this image isn't terribly helpful. So we will need to remove all the counters and then start by adding counters systematically.
First Look at Processor
To begin, let's right click on the graph and select "Remove All Counters". Next right click in the same area and select "Add Counters". The first thing we are going to look at is CPU usage. So add the following and clicking "OK".

We now see something like this:

This graph is now showing us the percentage of CPU time on each processor (in this example, I have 8 processors). The CPU time is broken down further into the following:
KIND OF WORK
% DPC Time
% Idle Time
% Interrupt Time
% Privileged Time
% Processor Time
% User Time
There are a couple of things we are trying to determine from the above graphic.
- Is the workload being spread across all CPU's or is the work load being done by only a few CPU's.
- Is the workload primarily composed of one of the above types of processor time (DPC, Interrupt, Privileged, User).
We will talk more about what these mean later on. For now, let's just look at how to find what we are looking for, make a note of it, and then we will analyze what we found at the end.
From the graph, it's clear that something is getting close to 100% utilization. You can determine the kind of work that is being done by scrolling down the list at the bottom while checking to see what line above it being highlighted.
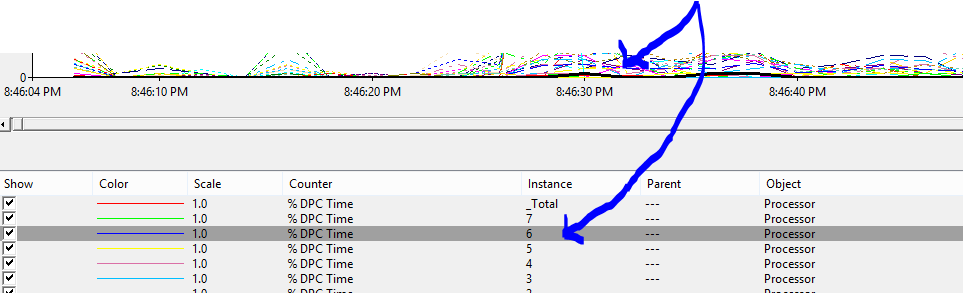
Here we can see that when we click on % DPC Time, instance 6 (or processor 6) we see that that kind of work is not what is using up the CPU. Note the black line in the graph.

When we click on % Idle Time, we see that it is very high in the beginning and drops off dramatically just as some other work begins to increase dramatically. You can click on each instance of % Idle Time to see if the pattern is consistent.
To see what kind of time is eating up CPU, click on the graph where is spikes up to around %100. Click on these different lines and look at the bottom to see what type of work is being done.

In our case, we see that the kind of work being done is privileged time and that privileged time work is spread across all 8 of my processors.
So the take away is this: The work being done is being done in privileged time and that privileged time work is spread across all 8 of my processors.
Next Look at Processes
Now that we know this, let's see if we can find what process is responsible for this privileged time work. Let's remove all our counters again and then add the following counters:

We are adding counters from the process object so that we can determine which process is responsible and we are adding the % Privileged Time counter because we know that the work being done is privileged time work.
NOTE: You will need to zoom out. In this case, right click on the graph part and select "Properties" then go to the "Graph" tab. Change the "Maximum" to 1000.

We had to change the graph because these counters will display differently than the previous counters. Since I have 8 processors, I need my graph to be at least 800 on the vertical scale. I went to 1000 just to get a better view. Here is what we see.

The take away here is that we see the process "consume" is responsible for the CPU utilization.
So our combined knowledge here is this:
- The process "consume" is responsible for our CPU utilization.
- That work that consume is doing it being done in privileged mode.
- That the work being done by this process is spread across all CPU's.
Next, let's talk about the work being spread across all processors.
It's possible that the application, due to how it is coded, will only use a single CPU. In this case, you wouldn't see the overall CPU usage spiking to 100%. But you would be able to identify that CPU that is spiking due to the work being done by that application.
Let's say that you are seeing that the work of a single process spread across 2 of your 8 processors. Again, this could be due to how the application is coded. However, it could also be due to someone setting that process to run on a specified processor or set of processors. You can do this by going to the Details tab in Task Manager. Right click on a process and select Set affinity. You should then see the following screen:

If only a few processors are selected and your application doesn't have enough processing power to get the job done in a timely manner, you could try adding processors here. Typically, this is not recommended, but if someone has already modified this setting, it is possible that the default was to use all processors and someone thought it would be a good idea to limit the number of processors used by that process.
Finally, let's talk about privileged time vs. user time.
Threads are the basic unit of code that run on a processor. Threads can run in privileged time or user time. Threads that are created by a process like Office or Google Chrome are run in user mode. User mode is for applications that run on your computer. Generally speaking, threads that perform operations within the operating system run in privileged time.
When a user mode process creates threads, there are kernel side threads that correspond to those user mode threads. So threads from that process are running in user mode but kernel mode (privileged) threads that correspond to the user mode processes are also running. If your CPU is primarily being taken up by privileged time, then the corresponding privileged (kernel mode) threads are responsible.
In order to determine the cause of this high CPU, you will need some more advanced skills. But what you can do is get a process dump of the process using Procdump. When you run it, be sure to use the -ma switch. This should capture both the user and kernel side information for that process.
If you know how to analyze a dump file and have the appropriate symbols, then you can look at the dump to determine the cause of the high CPU. If you do not, then you will likely need to contact Microsoft or a third party vendor (whoever made the software) and have them analyse the dump.
Additional Resource: https://blogs.technet.microsoft.com/winserverperformance/2009/08/06/interpreting-cpu-utilization-for-performance-analysis/
No comments:
Post a Comment